
Edelweiss Analytics is an add-on to Catalog Services that provides real-time information about how your titles are performing across independent bookstores.
Use this training page to learn how Analytics data can help you better understand your accounts and make sure they are stocked with just the right titles.
This training brings together a mix of video demos, assignments to test your knowledge, and further reading to delve deeper into features. Everything is designed to be taken at your own pace! If at any moment you have questions, feel free to reach out to us at support@abovethetreeline.com.
Edelweiss Analytics Curriculum
Introduction to the Analytics Lanes
Video Instruction (14 minutes)
Try It Yourself! Sample Assignments
Tool Tip: Using the Analytics Title View
Calculating Shelf Days
Additional Analytics Documentation
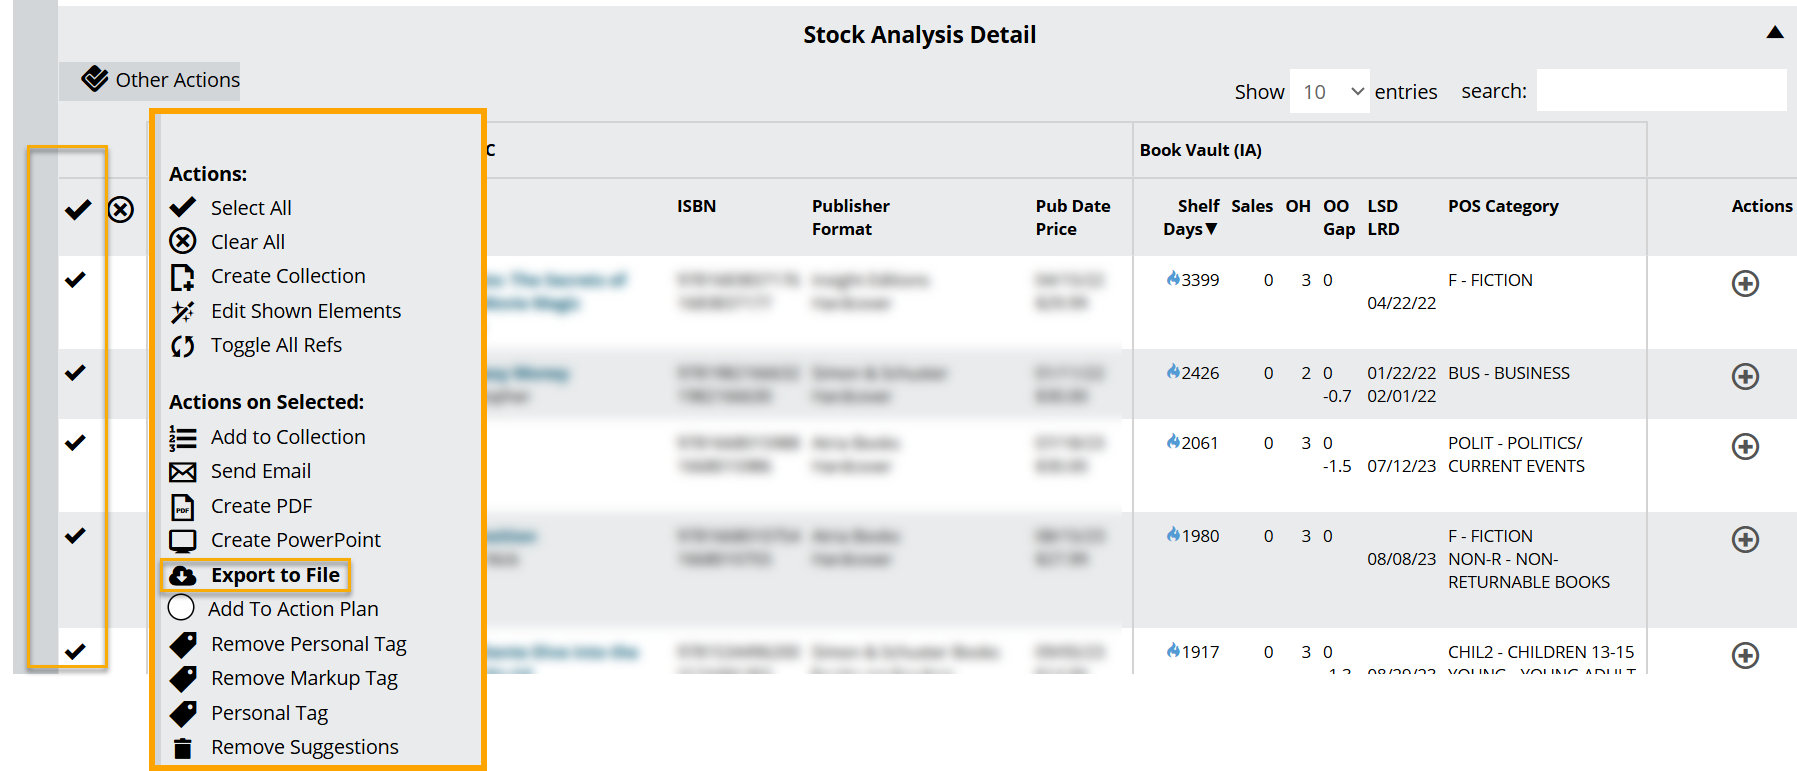
Ready to dive into Edelweiss Analytics? Get started by clicking into Analytics tab.

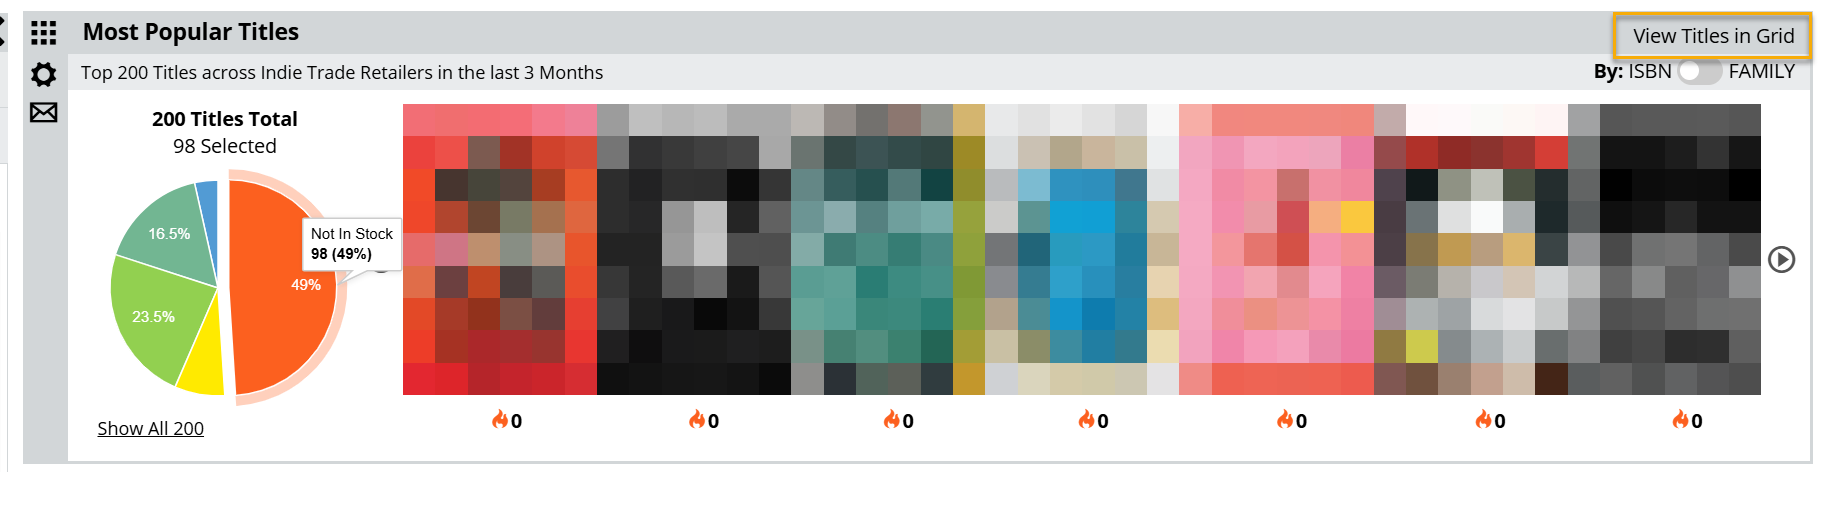
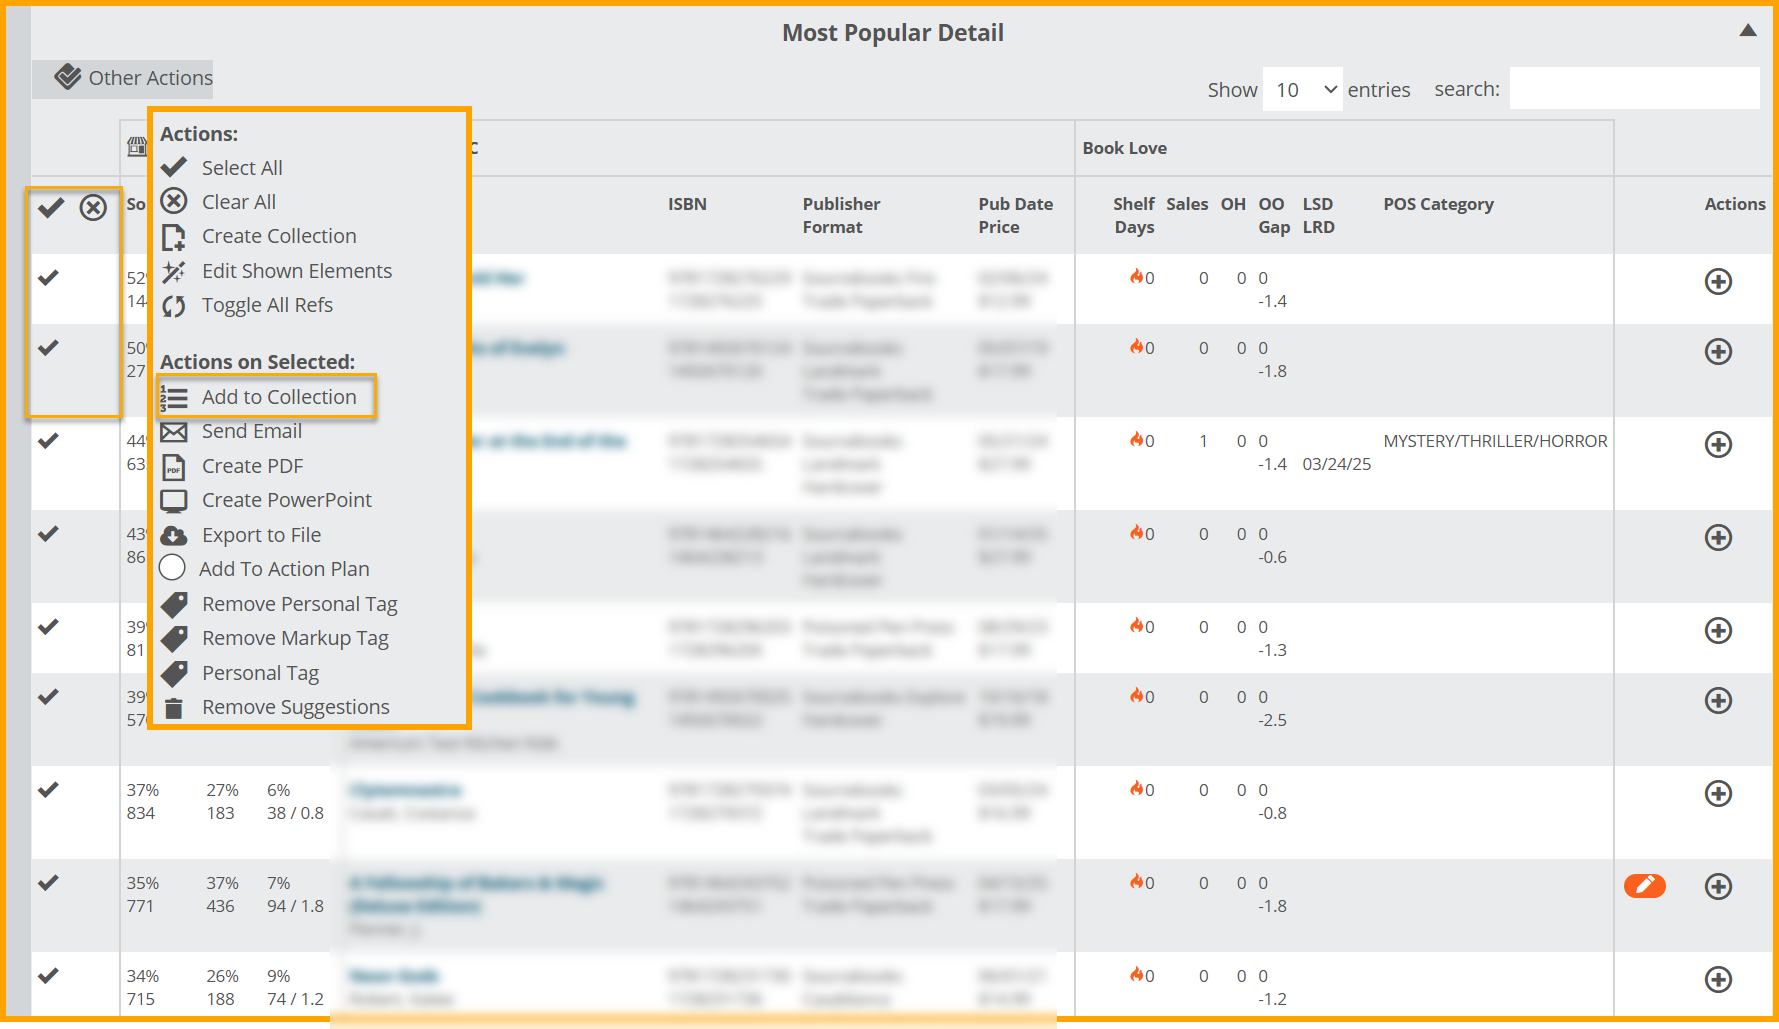
Here, you'll find a variety of lenses ("lanes") to explore sales and ordering information from the stores that send us their POS data.
Each lane on the Analytics Tab presents a distinct view of a selected account's success with your titles. Click through the lanes below to learn more about the data they analyze.
Once you've reviewed the Analytics lanes, click Play below to be guided through leveraging this data to work with your accounts.
Try it yourself! Throughout the video training, we encourage you to pause and do some suggested activities. Explore the assignments below.
tool tip
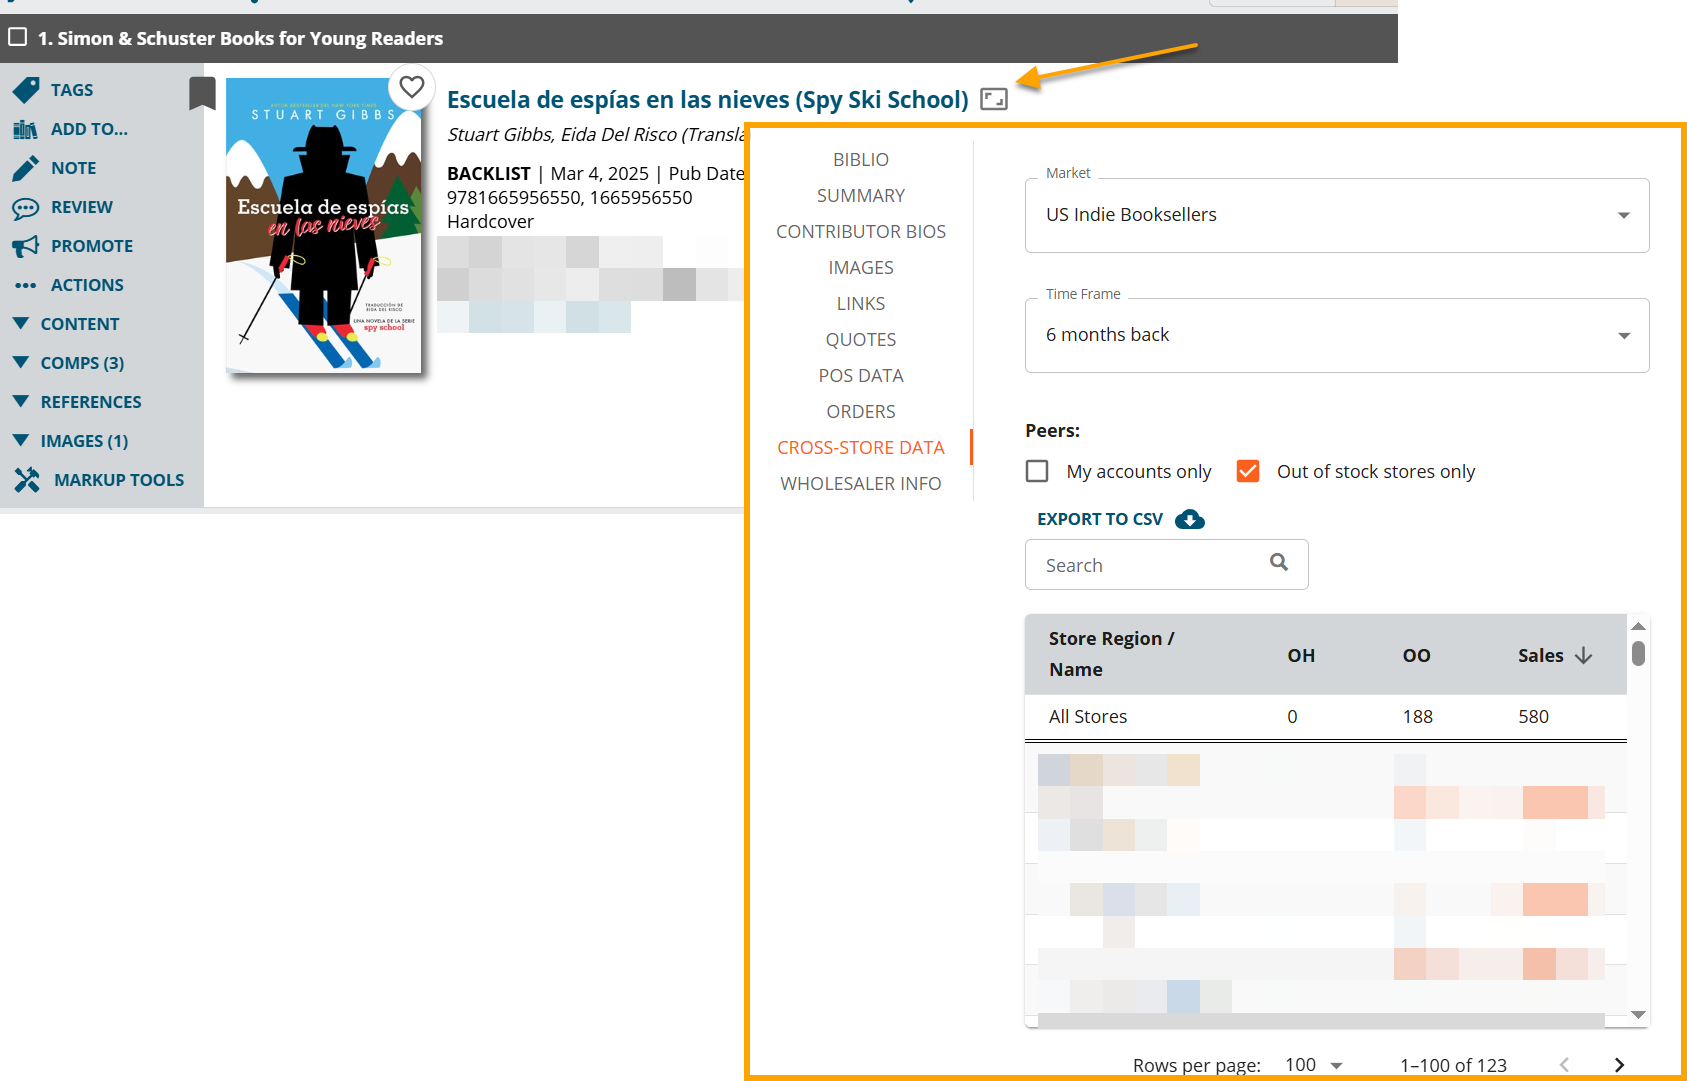
In addition to the Analytics tab, you can quickly access Analytics data (On-Hand, On-Order, and Sales quantities for accounts) for any of your titles while browsing Edelweiss. Simply open the book in Presentation View and click into the Cross-Store Data tab.

Calculating Shelf Days
The charts and graphs in Edelweiss Analytics evaluate the performance of titles using Shelf Days.
Shelf Days are based on a simple calculation: Copies On Hand X Days Since Last Activity
Titles are then sorted into "fresh," "stable," and "stale" designations based on their number of Shelf Days.
Give it a try! If a store has 2 copies of a title on hand and sold a copy 5 days ago, what would the Shelf Day number be?